webext-profiler: Puppeteer-based automated performance profiling tool of browser extensions
A browser extension enhances your experience by incorporating personalized features directly into your browser. However, they may also have the downside of potentially slowing down your browser and negatively impacting your internet surfing experience.
How do we analyze the browser extensions’ impact on web performance?
As an extension developer, I observed that though there are tools for conducting general web performance profiling, such as Lighthouse, there is a lack of methods to benchmark the performance of browser extensions. Recognizing this gap, I developed an automated browser extension performance profiling tool using Puppeteer. This tool enables developers to effortlessly extract web performance metrics while evaluating the impact of various extensions in an automatically launched browser environment.
- Github repository: webext-profiler
Why do extensions slow down the browser?
Before delving into performance issues, let’s explore the structure of a browser extension. Each extension requires a manifest.json file in its root directory, providing crucial information about its structure. An extension typically consists of three main components:
- background script: Scripts that handle browser events.
- popup: A dialog that you can display when the user clicks on a toolbar button.
- content script: Scripts included with your extension, that will be injected into web pages.
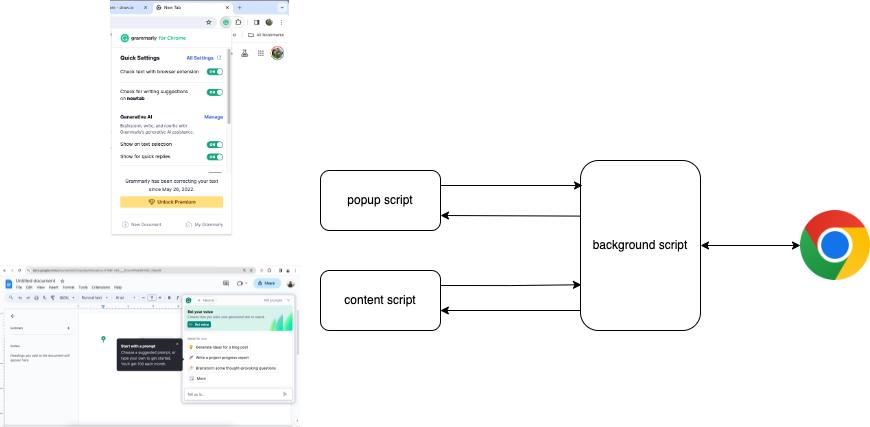 The main components of the Grammarly extension
Take Grammarly extension’s manifest.json as an example, which provides insights into its structure. The background script references sw.js, which imports another file src/js/Grammarly-bg.js. The popup is linked to src/popup.html. Regarding the content script, the extension loads distinct JavaScript and CSS files when a page is opened that matches a certain URL pattern. For example, when the page URL matches the pattern *://docs.google.com/document/*, src/js/Grammarly-gDocs.js is injected into the Google Docs, providing users with real-time writing feedback.
Returning to our initial discussion, which component slows down the browser? Each of the three components consumes additional computing resources, but the content script notably affects the user experience.
All users desire swift page load time and smooth animation during website browsing, but quantifying that experience can be challenging. The Performance tab in Chrome DevTools can help. It offers detailed information about how the page is loading and rendering.
By comparing the performance analysis of loading the example page with and without the extension installed, it becomes evident that the injected content scripts hinder the main thread, detrimentally increasing the scripting time while loading the page.
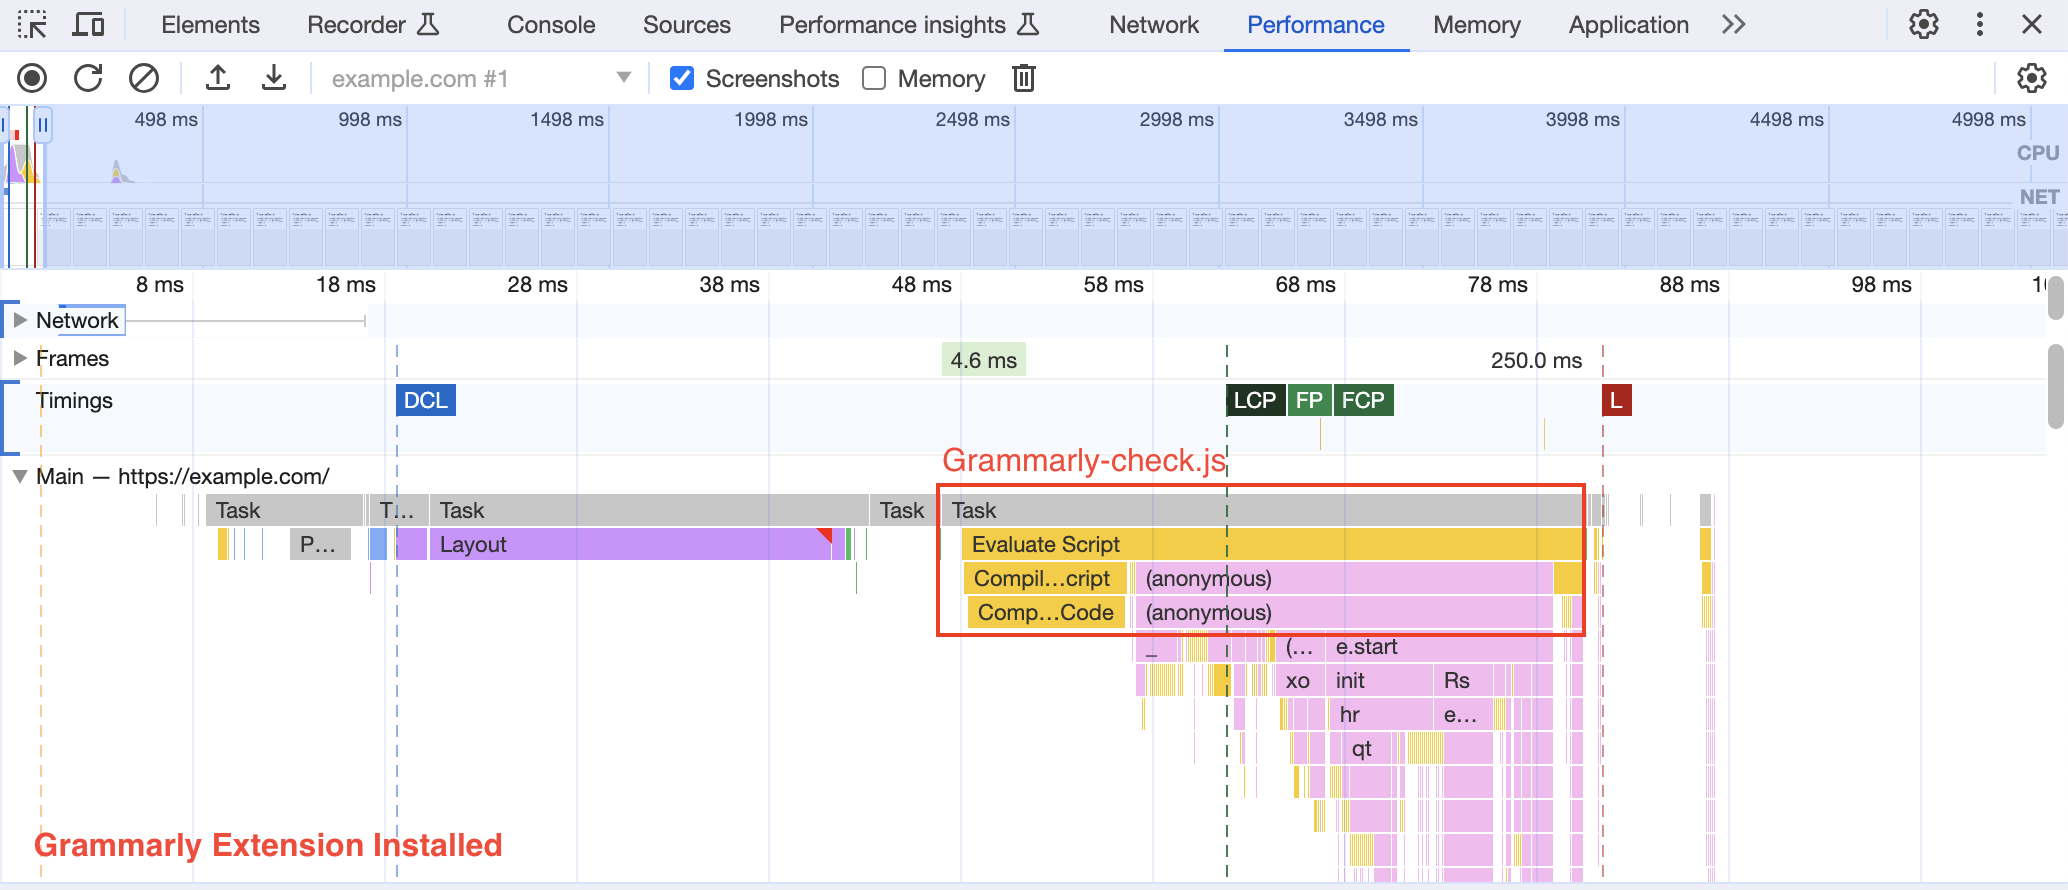 example.com page load performance with Grammarly extension installed
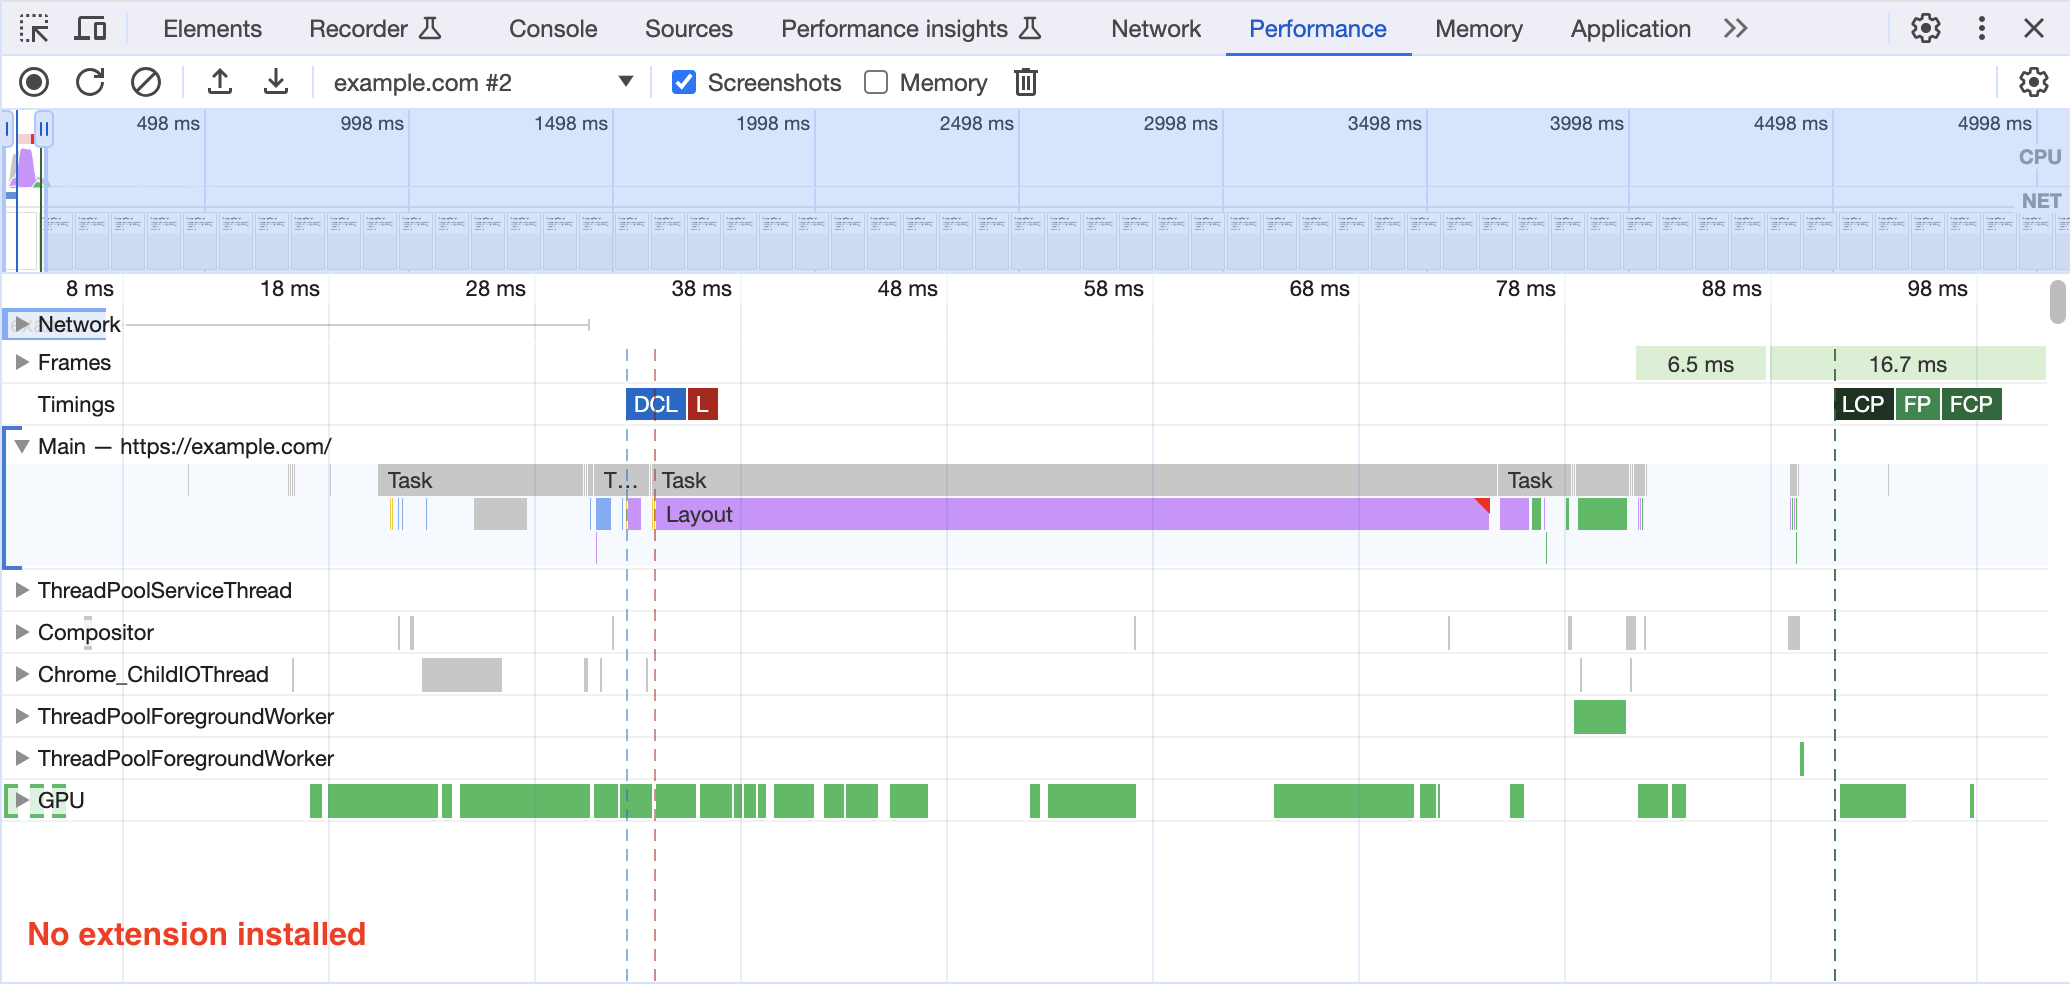 example.com page load performance without extension installed
How to collect the extension performance metrics?
Our next step involves designing an experiment to benchmark the performance of extensions.
To create a baseline of web page load performance, we load a specific page and collect metrics as the control group. Afterward, we load the same page in browser with the extension installed, extracting performance metrics and compare with the baseline. This approach allows developers to gauge the resources consumed by the extension and facilitates performance comparisons across different extensions.
Manually repetition of tests is time-consuming and costly. By creating an automated test using Puppeteer, which offers a high-level API to control Chromium, we streamline the process and pave the way for a standardized quality evaluation procedure.
Test Flow
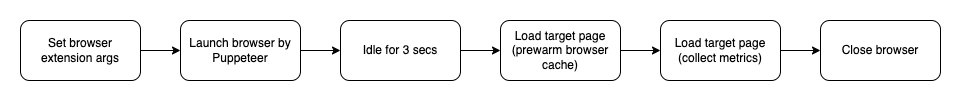 Test flow of the automated performance test script
- Why does the script idle for 3 secs in the beginning?
This ensures that we test the page load after the background script has fully initiated.
- Why and how to prewarm the browser cache?
We desire to know how much time in the page load duration is costed by our extension. However, the bottleneck of the first landing on a merchant page is often the image and other sub-resources. The loading time of those resources highly depends on network speed, and also overlaps with content script execution time. As a result, we land on the target page first to prewarm the cache, and land on that page again to retrieve the performance metrics.
Performance Metrics
We collected metrics by two methods: one is directly calling Puppeteer.metrics() and the other is utilizing PerformanceNavigationTiming API. Below are the list of metrics we tried to collect during the script:
- Task Duration(ms): Combined duration of all tasks performed by the browser.
- Layout Duration(ms): Combined durations of all page layouts.
- Style Recalculation Duration(ms): Combined duration of all page style recalculations.
- Script Duration(ms): Combined duration of JavaScript execution.
- JS Heap Used Size(ms): Used JavaScript heap size.
- Page Load Duration(ms): PerformanceNavigationTiming.loadEventEnd — PerformanceEntry.startTime
- Sub Resources Duration(ms): PerformanceNavigationTiming.loadEventEnd — PerformanceNavigationTiming.domContentLoadedEventEnd
To make the results more reliable, we iterate the page load script several times and get the mean of the data. Furthermore, we generate an analysis HTML report and visualize the data by plotting bar charts.
Example: Performance analysis on Grammarly, Rakuten Cashback and Honey extensions
Let’s conduct an easy experiment on three popular extensions: Grammarly(14.1143.0), Rakuten Cashback(5.35.0) and Honey(16.3.4).
Preparation
The first step is preparing the extension artifacts. The source of those extensions can be found locally if you have installed them in your Chrome. Please refer to webext-profiler README.md for step-by-step tutorial.
Secondly, prepare the environment variables. In this example, we set the .env file to:
1
2
3
4
5
6
export EXT_NAMES=Grammarly,Rakuten_Cashback,PayPal_Honey
export ITERATIONS=10
export HEADER="Grammarly, Rakuten_Cashback, PayPal_Honey Extension Performance Test"
export FILENAME=extension_performance_test_report
export BASE_EXT="no ext"
export TEST_PAGES_PATH=tests/test.json
Lastly, we create a JSON file to list out the target pages we are going to test. Here we test two pages, a simple website example.com and Google Translate.
1
2
3
4
5
6
7
8
9
10
[
  {
    "testTitle": "Load Example Page",
    "url": "https://example.com/"
  },
  {
    "testTitle": "Load Google Translate Page",
    "url": "https://translate.google.com/"
  }
]
Results
The first test case is to load a super simple website example.com so as to isolate the extra CPU time and memory usage of each extension.
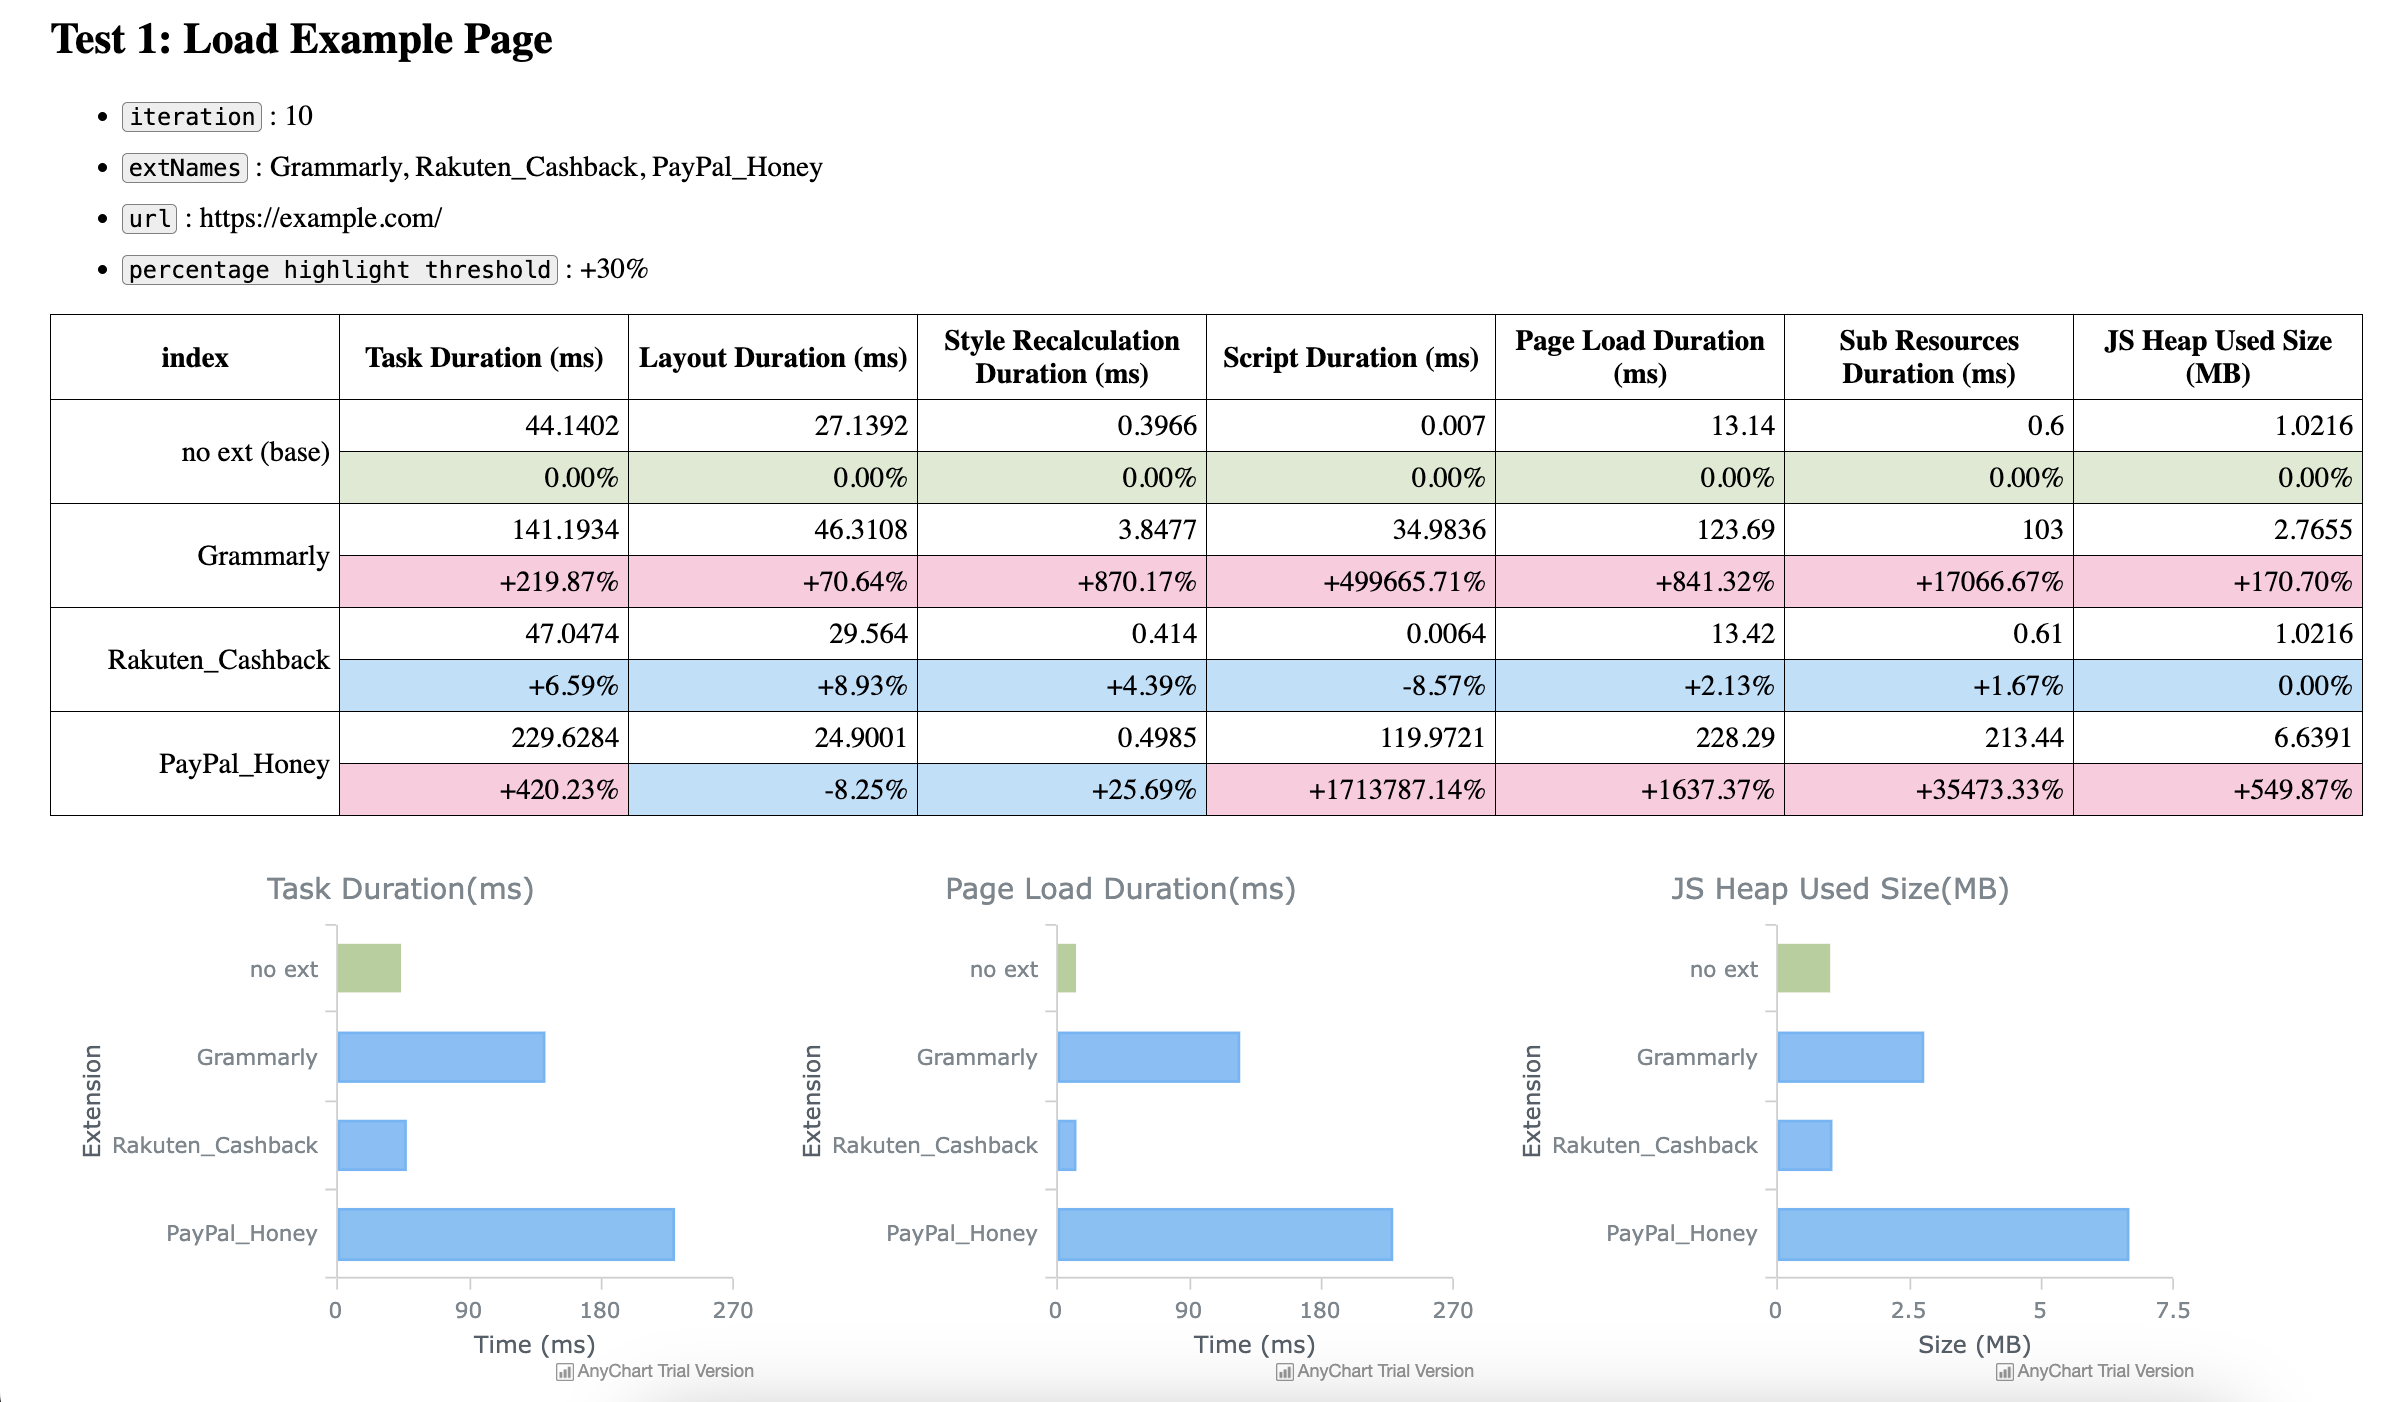 webext-profiler testing results for loading example.com
In this evaluation, the Rakuten Cashback extension performed the best among these three extensions, hardly affecting web performance when compared to the baseline. On the other hand, the Grammarly and Honey extensions adversely influenced the CPU time for loading the example page, adding an extra 97ms and 185ms, respectively.
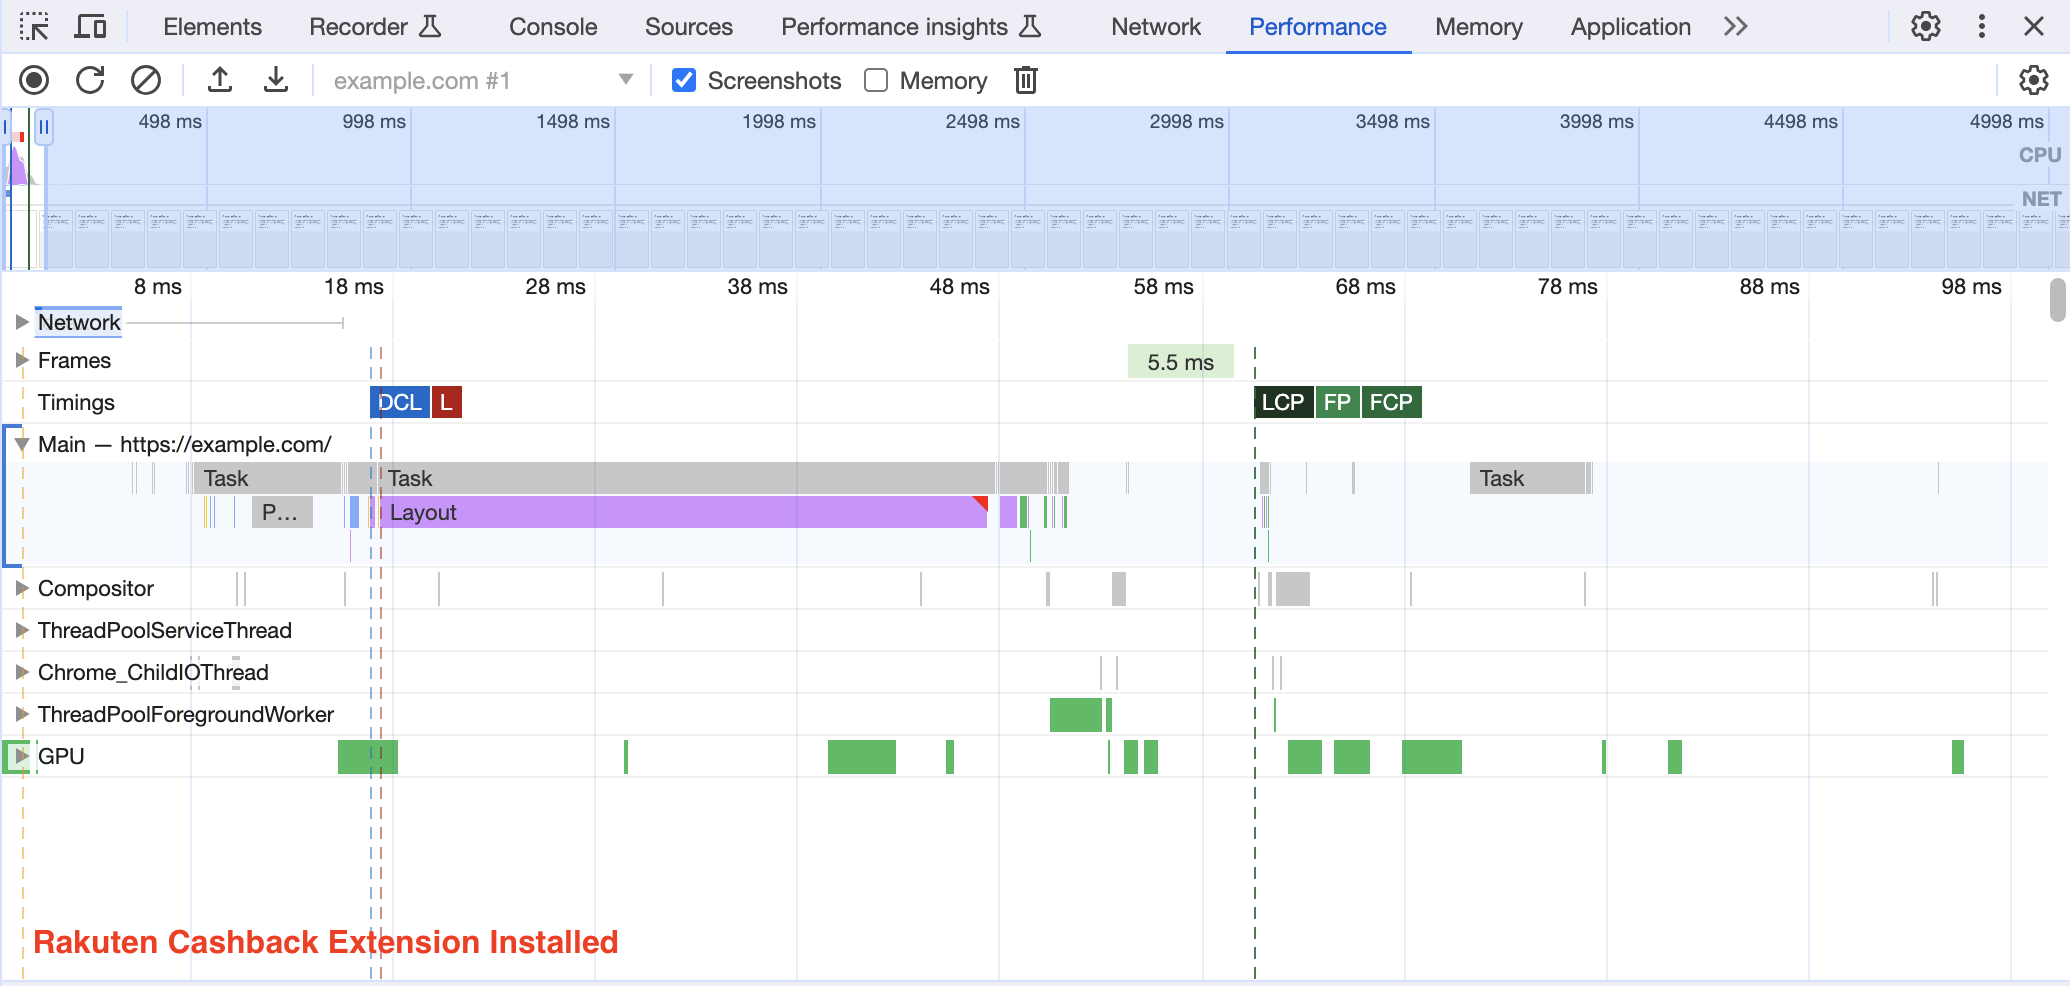 example.com page load performance with Rakuten Cashback extension installed
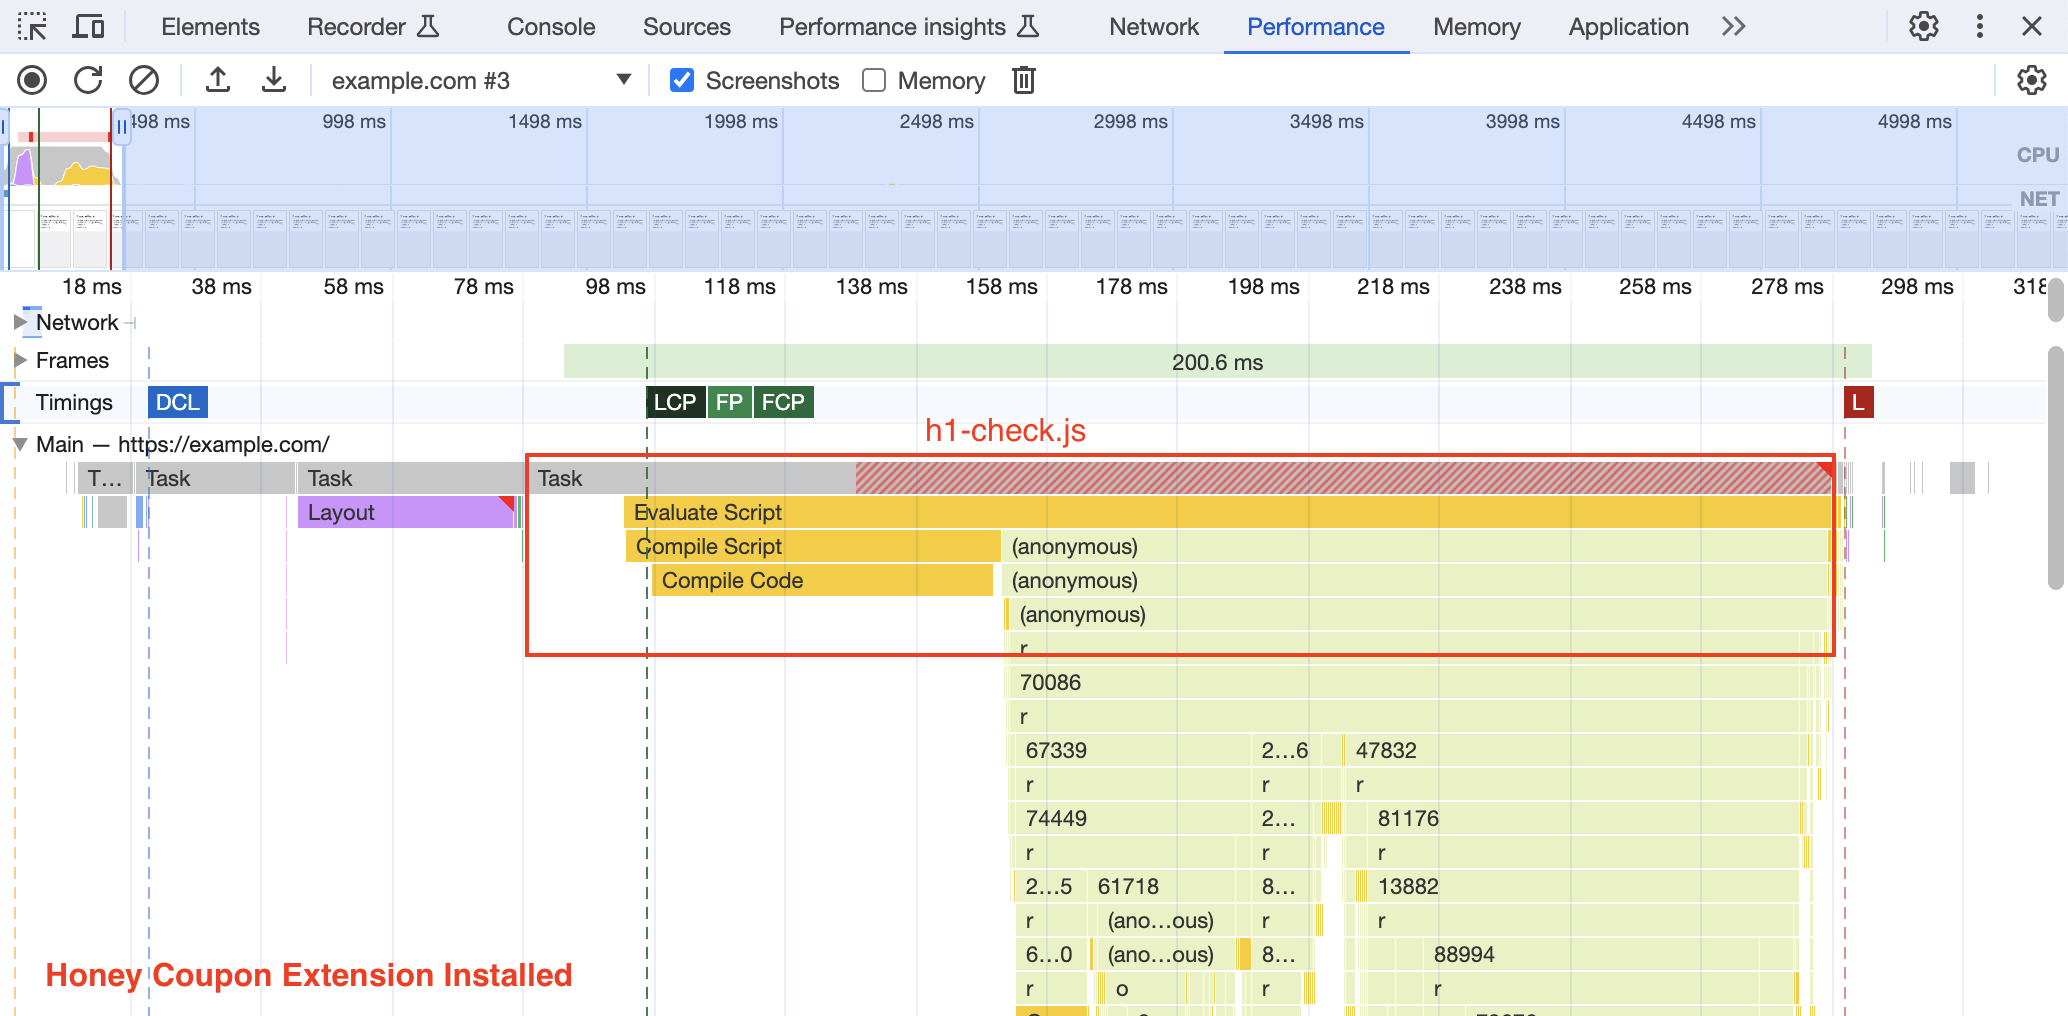 example.com page load performance with Honey Coupon extension installed
The performance analysis using Chrome DevTools aligned with the previously mentioned findings. It revealed that despite not offering additional features on this page, the Grammarly extension injected Grammarly-check.js, and the Honey extension injected h1-check.js into the example page, potentially resulting in additional runtime. In contrast, the Rakuten Cashback extension did not inject any content script into this page.
Moving forward to the second test case, which is to load the Google Translate page.
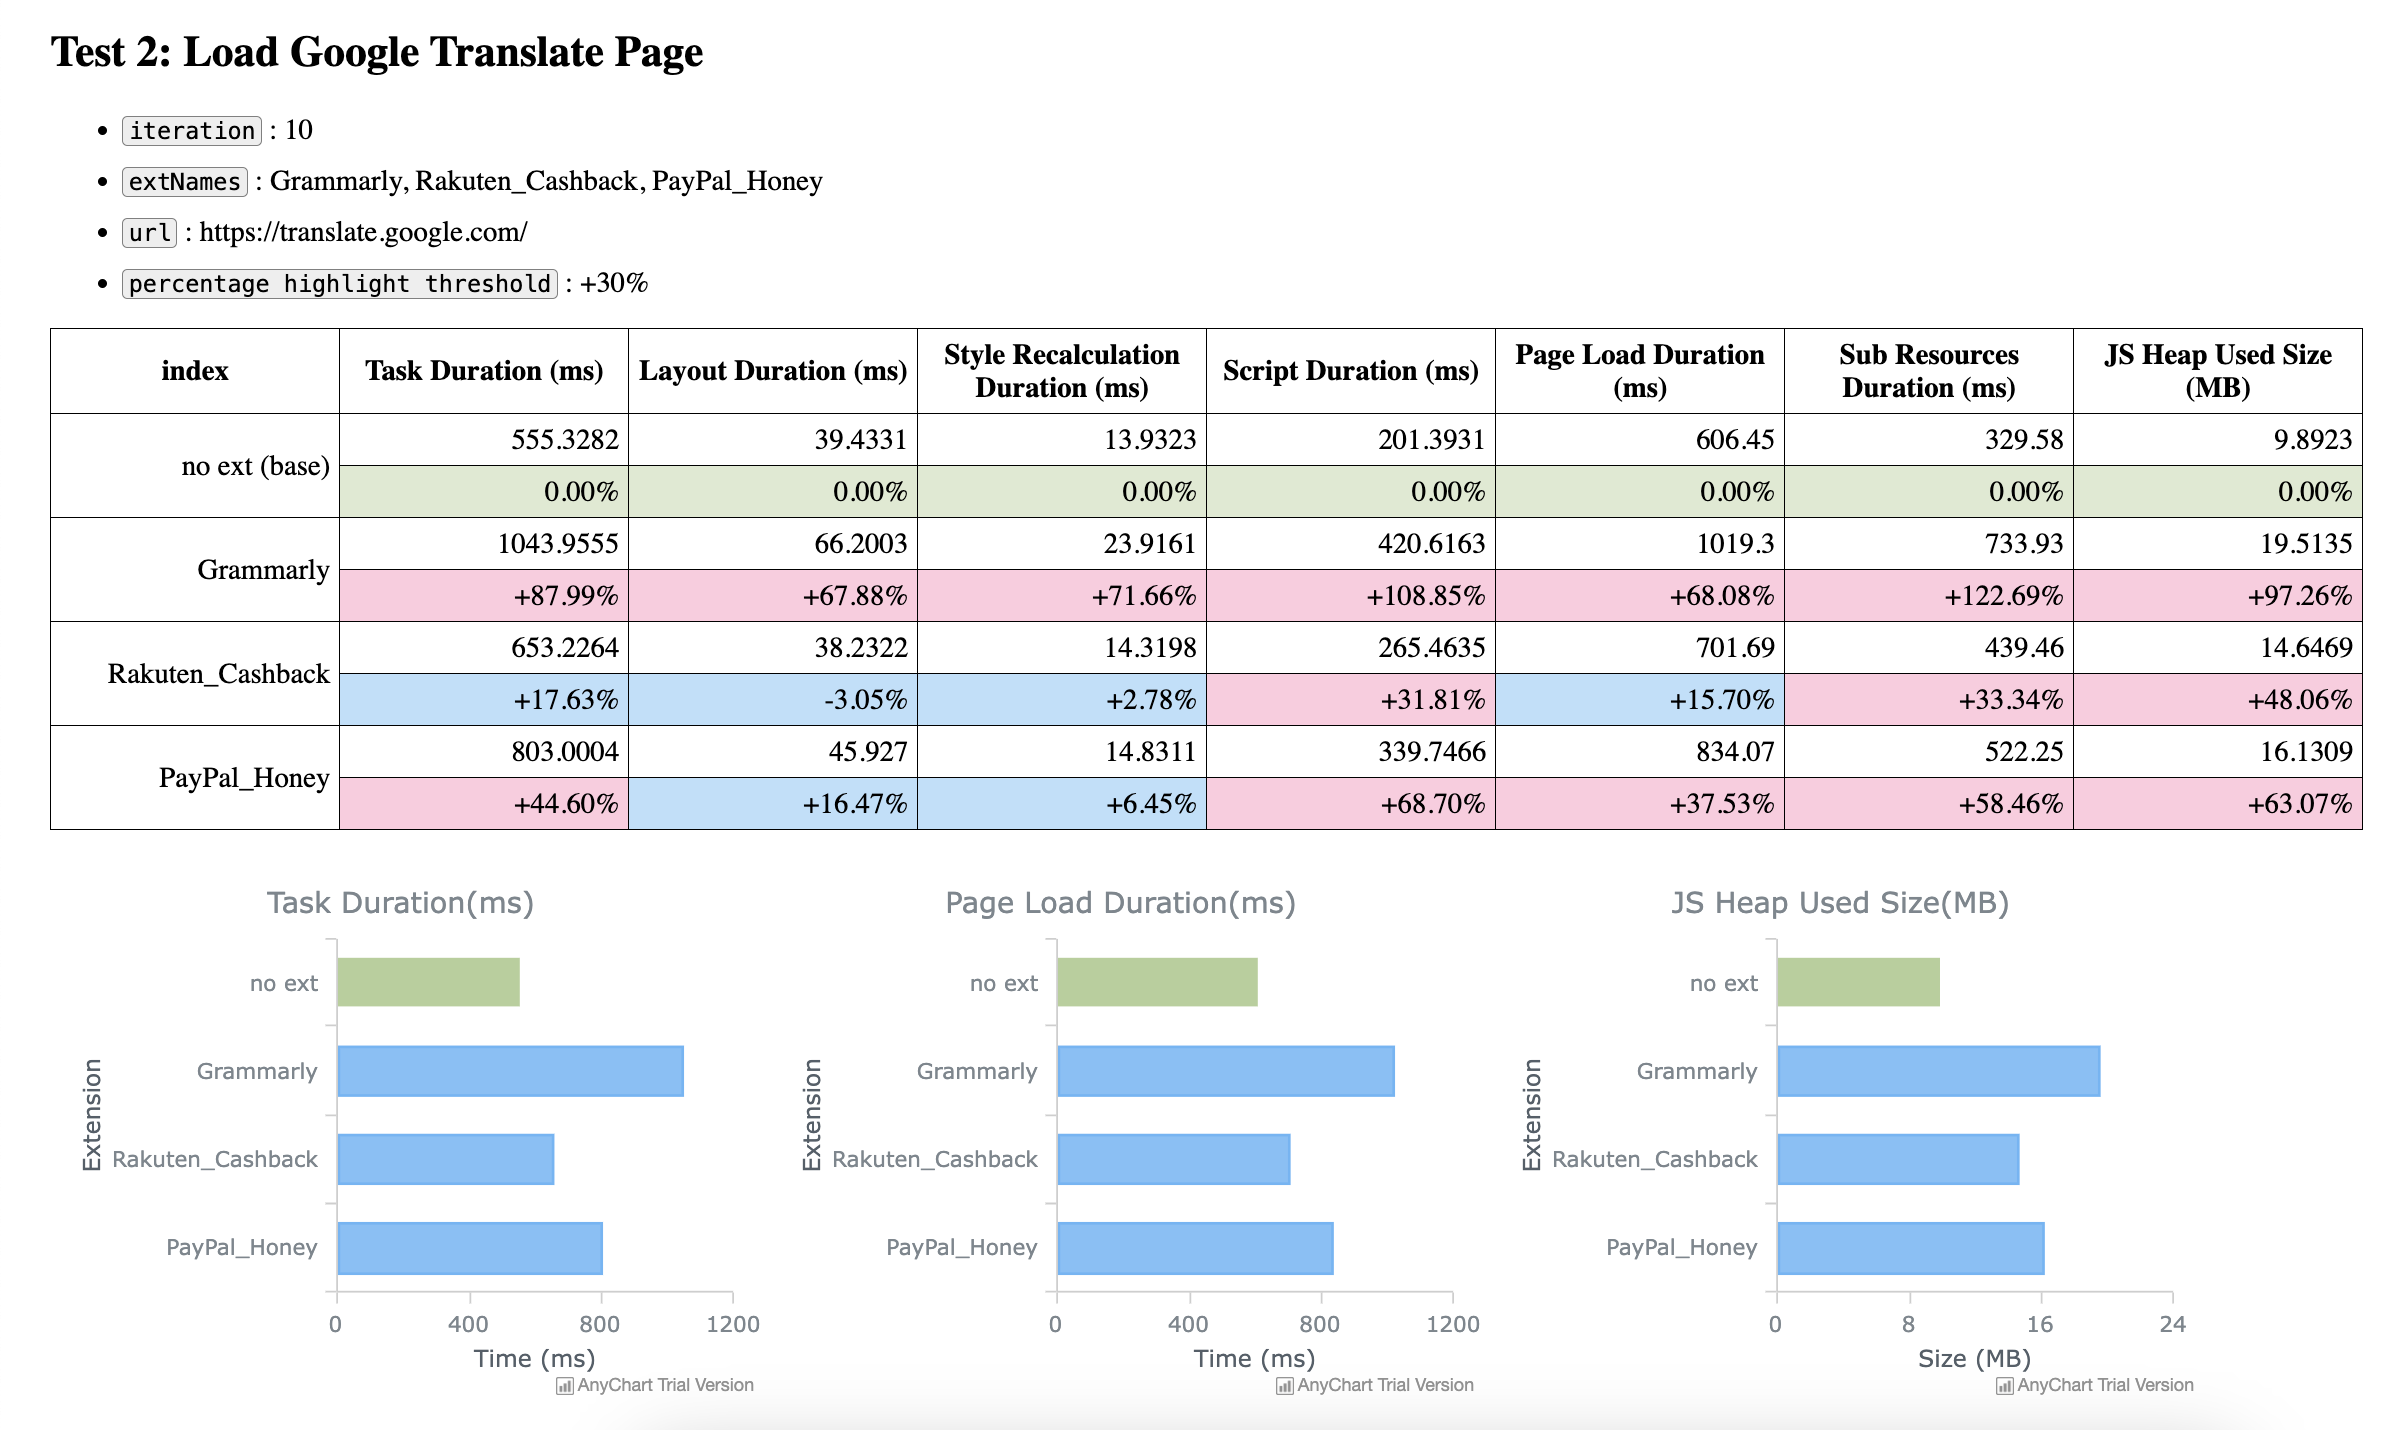 webext-profiler testing results for loading Google Translate
Grammarly extension provides real-time writing suggestions on the Google Translate page. As a result, it makes sense that the Grammarly extension cost more CPU time and memory in this round of evaluation.
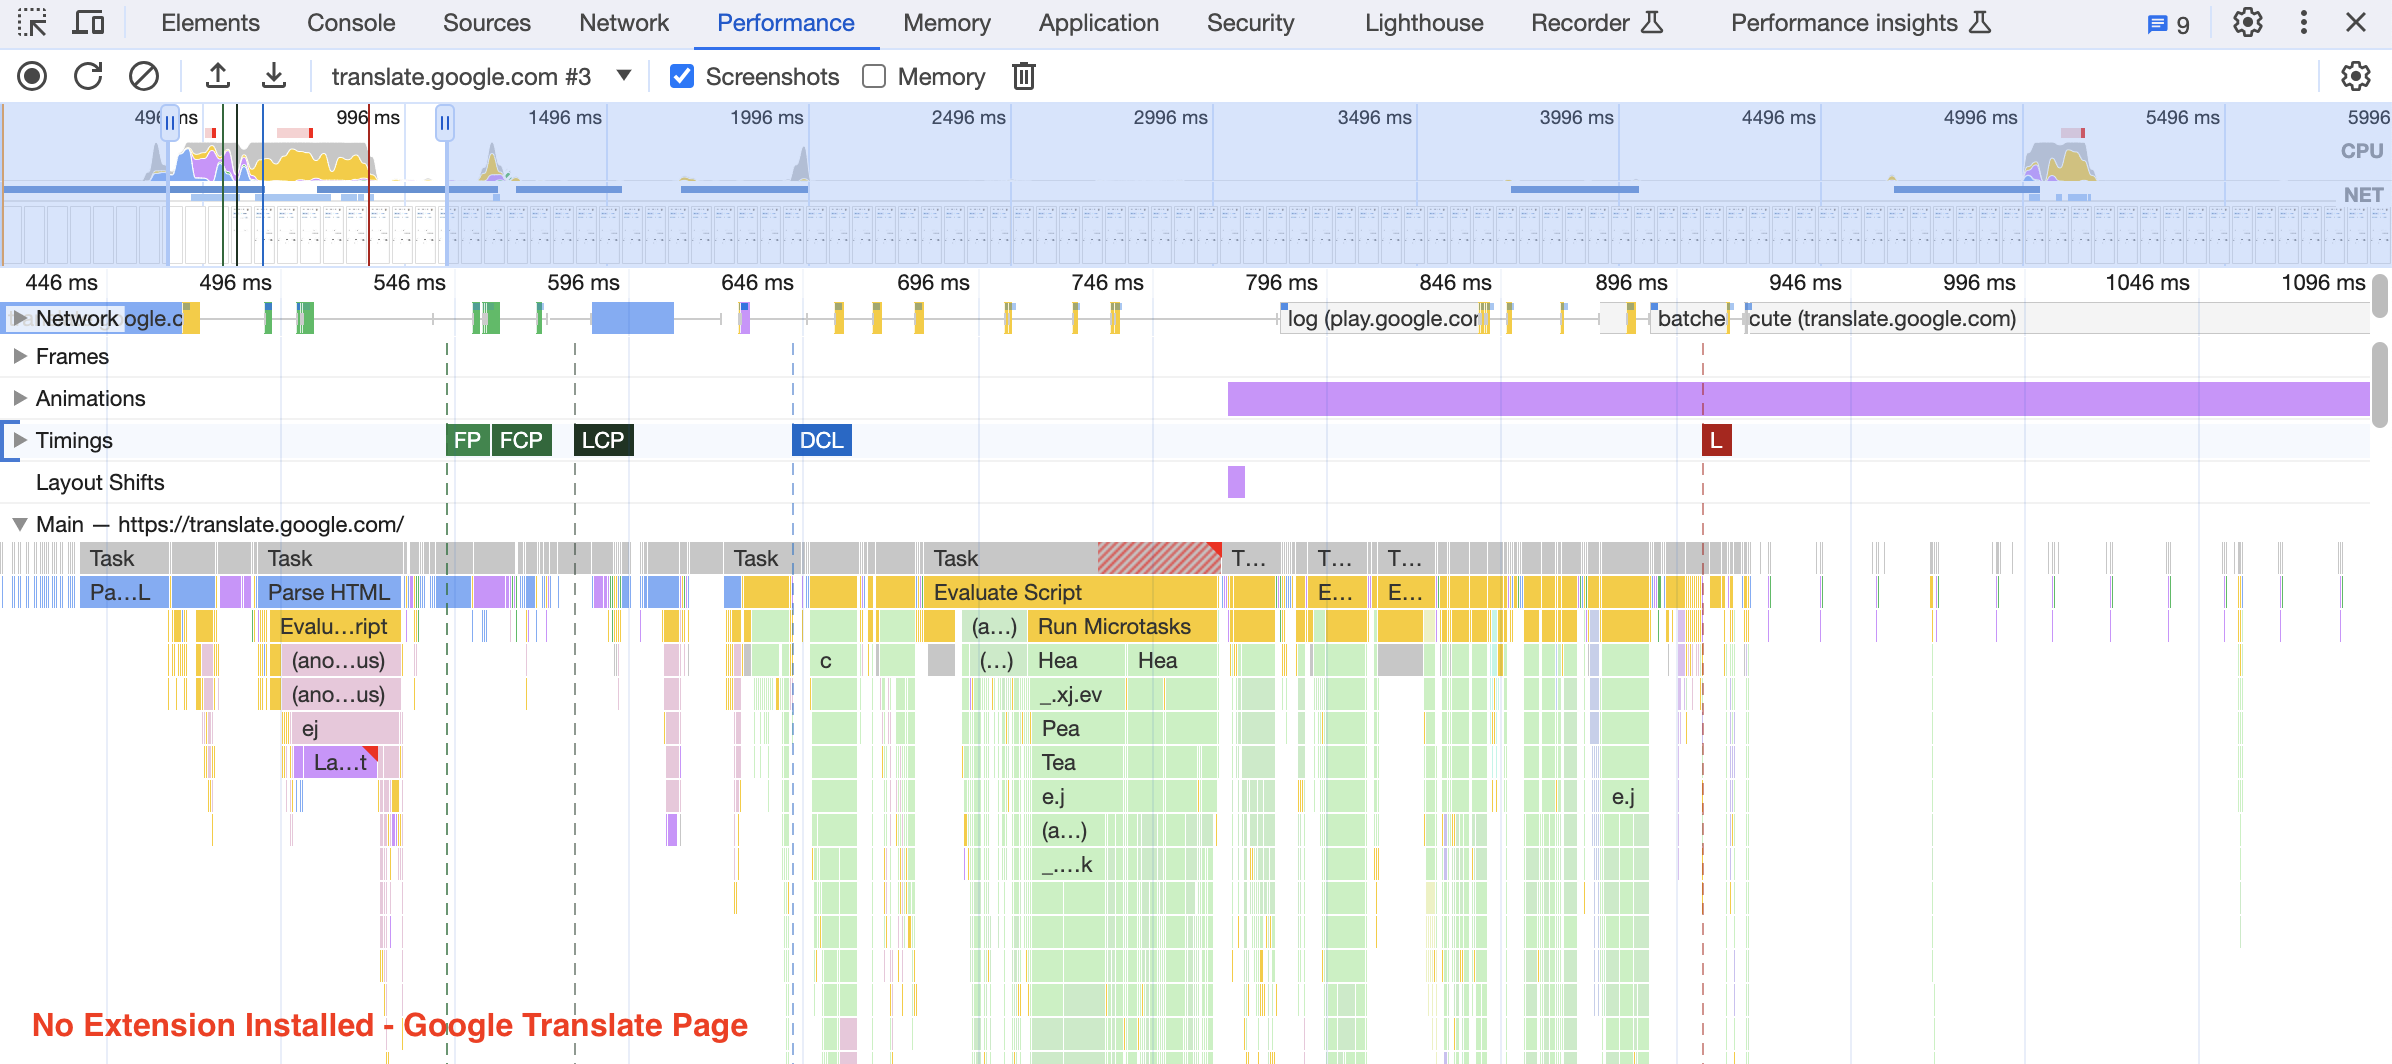 Google Translate page load performance without extension installed
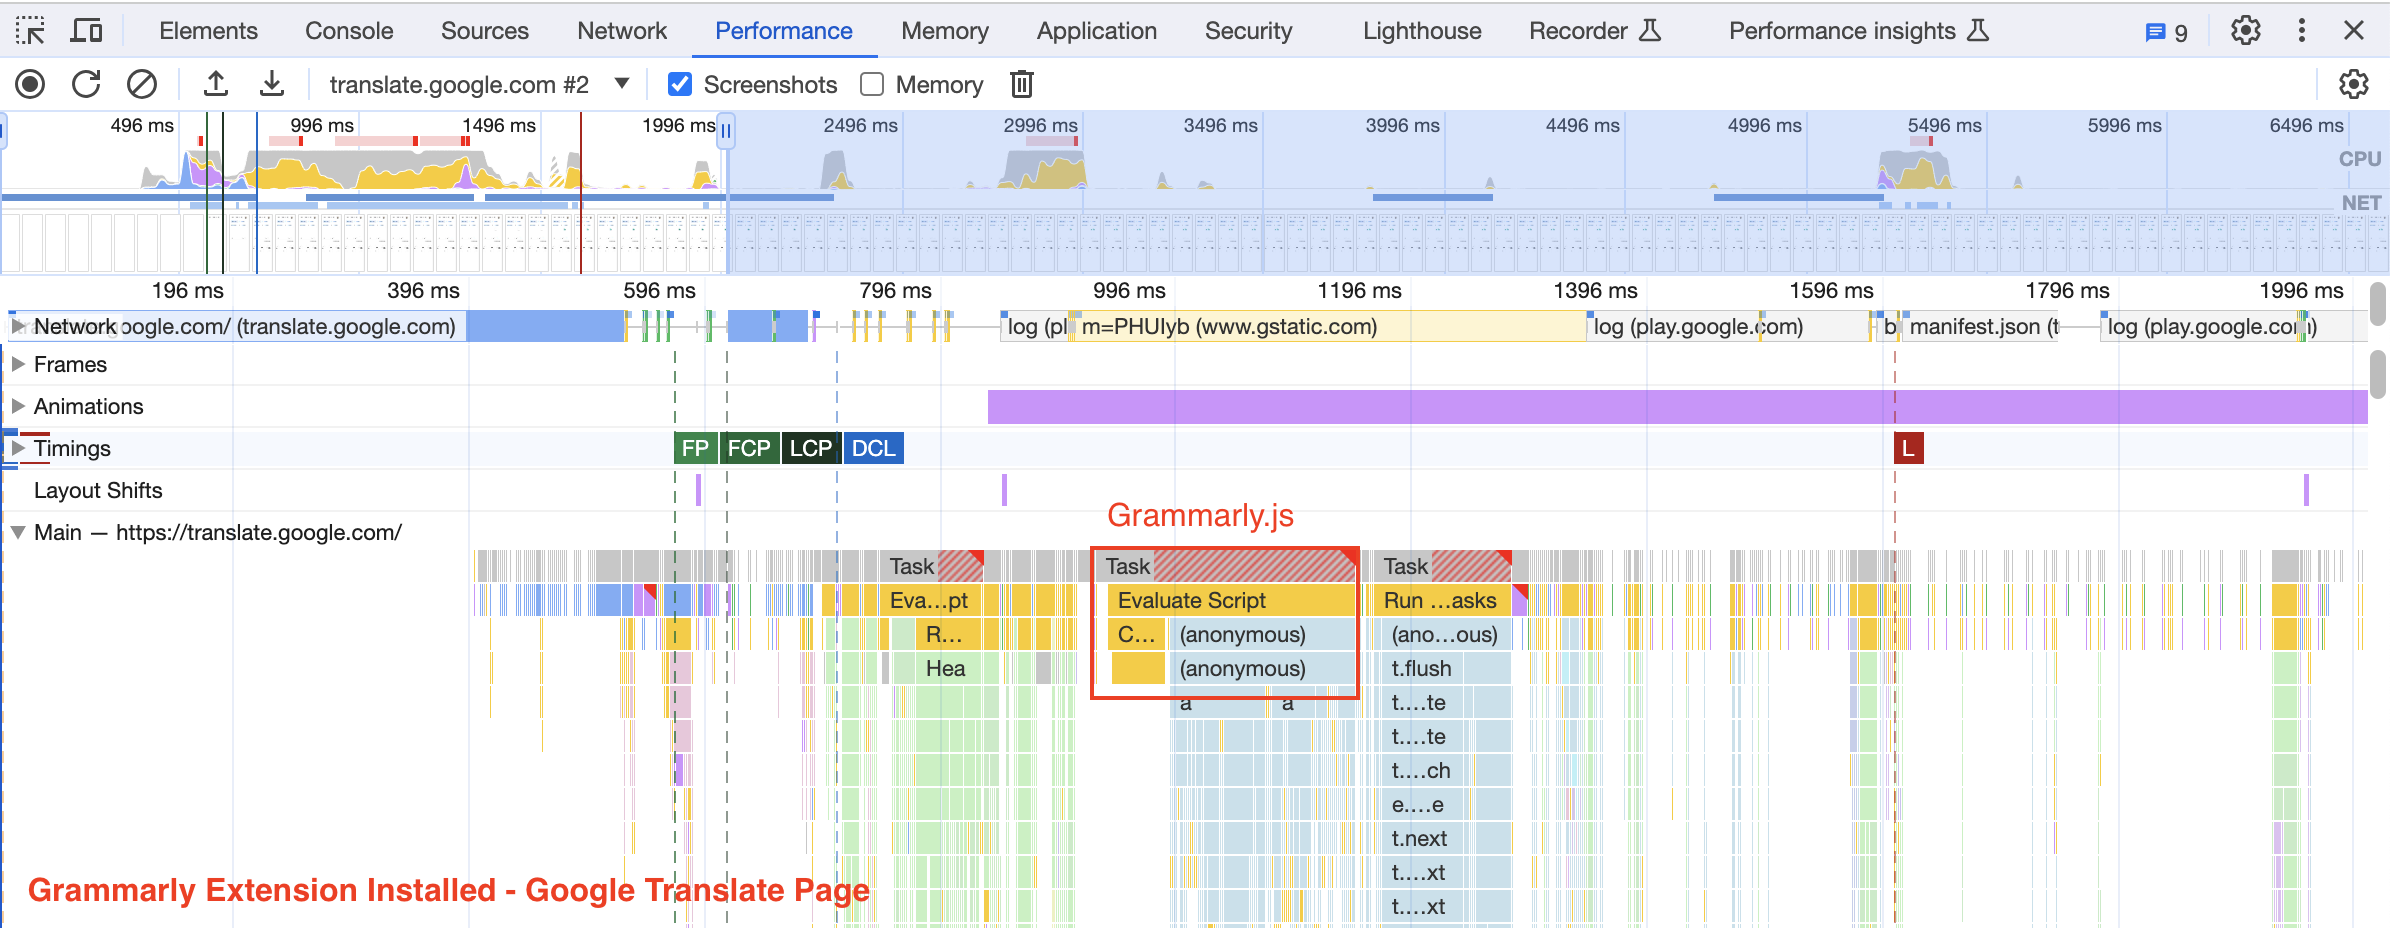 Google Translate page load performance with Grammarly extension installed
In addition to comparing the performance of various extensions, this tool also enables a quality check for release performance. If you are an extension developer preparing to launch an updated version, you can designate your current version as the baseline and execute the test suite to determine if the new version exhibits inferior performance compared to the existing one.
Key Takeaways for browser extension developers
Make good use of content script match patterns and only load the script if necessary, since executing CPU-consuming tasks in the content script will seriously affect the page load speed.
Keep the JS bundle size as small as possible. The bundle size could be eliminated by reducing the use of unnecessary packages.
Focus on the communication between content scripts and the background script, especially the actions that might cost lots of resources, for instance, local storage IO.
Proactively examine your extension artifacts’ performance before they are released to the production environment.